More detail on FOOD PRODUCTION and WATER SCARCITY. pages
- Biocapacity – per Global Footprint Network – GFN
- Sustainable Earth – per GFN
- Rapid Ecological Collapse
Bio-Capacity Issues:
We are now consuming 4.5 times the Planet’s Biocapacity,
if all 7.5 billion people had a Western diet and lifestlye.
.
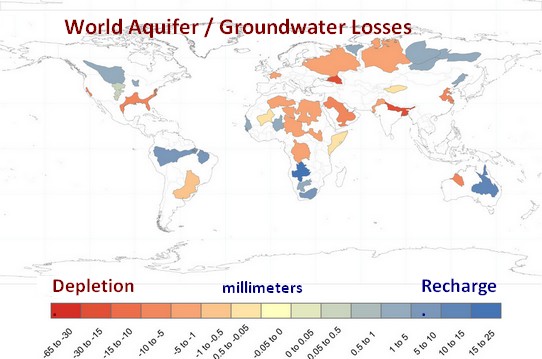
So why haven’t we run out of renewable resources yet, like Food and Water? Well, we have run out!! Aquifers are drying-up and crops are on life-support.
Understanding BIOCAPACITY
– per Global Footprint Network – GFN
For many years now, the Global Footprint Network has been tracking a fascinating measure of World Productivity, called Biocapacity. Think of the Earth’s Capacity to regenerate and sustain Biological functions, like growing plants and forests, or raising or catching animals, including fish. When more nutrients and fresh water are removed, and more energy expended than can be sustained, a region has an Ecological Footprint larger than its Biocapacity – it is harvesting more than it can produce and regenerate over time. A chart of overuse of renewable resources follows.
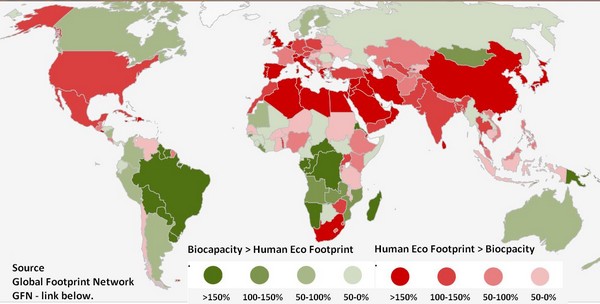
Here is a link to a (2013) map of GFN’s Ecological Footprint of Nations. Technical explanations on the site are much better than the simple version given here. The GFN continues to produce high quality, valuable research. See also: Eco Footprint Measures at this site.
The image shows quantitatively the overuse of Biocapacity by nation, relative to Human Ecological Footprint.
There are two ways to reduce the over consumption, or Overshoot of consumption vs biocapacity.
- First, people could scale back richer food sources, to ones more affordable, as shown on the Food Production page. This would also reduce pollution from fertilizers. Reduction in Energy consumption, and ongoing access to fresh Water, are part of the equation.
- Second, through strictly ethical means, like education, the World’s Population might be reduced and better matched to its Biocapacity.
- Economic solutions compatible with capitalist drivers are needed; these are also a focus at RescueTheWorld.net
To paraphrase a famous data quote from GFN’s research,
“We are now consuming 4.5 times the Planet’s Biocapacity,
if all 7.5 billion people had a Western diet and lifestlye”.
Return to the top
SUSTAINABLE EARTH
Developed Countries Exceed Their Biocapacity
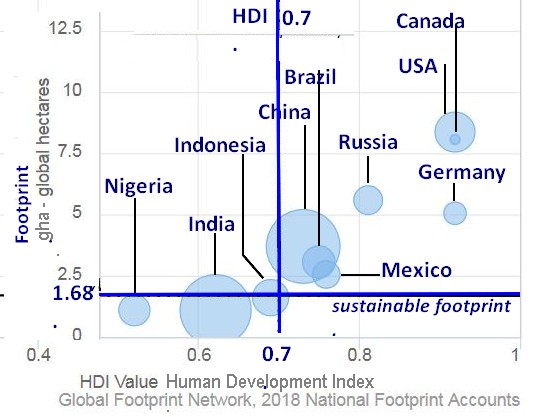
The horizontal blue line at the bottom of the graph stands at 1.68 gH (or global hectares). This is the average biocapacity per person that is sustainable by the planet earth. Clearly most western countries are above this level, and even China has just passed it.
___
A Sustainable Earth:
>> HDI > 0.7 and Footprint < 1.68 gH
HDI: The vertical blue line on the graph is a UN human development index (HDI) value of 0.7. It is a composite of life expectancy, access to education, and GDP per capita. An HDI value of 0.7 is considered relatively high – where basic needs can be met and persons have opportunities to live a rewarding life. It is only an average – large disparities exist between ruch and poor.
1.7 gH per person: The GFN suggests that a Sustainable Earth have all countries with HDI above 0.7 and eco-footprint below 1.68 gH. Very few countries meet both these criteria. Again, reductions in consumption and sheer population are required. GFN helps measure progress against these goals.
Your Personal Ecological Footprint
Explore this concept at the Energy & Carbon page, and measure your impacts using the Footprint Quiz link posted there. Go to Individual Footprint & Quiz.

.
RAPID ECOLOGICAL COLLAPSE
So why haven’t we run out of renewable resources yet, like Food and Water? Well, we have run out!!
But by continuing to deplete and damage ecosystems, adequate food (for many) continues to be temporarily available. Depletions are discussed on this site and include:
- Reductions in aquifer or ground water reserves
- Excess fertilizers for agriculture (and run off harming oceans)
- Loss of forests to absorb CO2 and reduce warming
If this all sounds a bit “gloomy & doomy”, consider the consequence of “business as usual” or doing nothing.
- Rapid Ecological Collapse:
- Not gradual degradation that we see now and are measuring.
- Rather, world-wide famine, and loss of access to fresh water.
- Decimation of the world population by famine & disease.
- Perhaps in 2050 or 2100; within our children’s lifetimes.
- Nature will find a way to strike a balance.
Other civilizations have been wiped out by a combination of fast population growth, deforestation, over-farming, and drought (Angkor, Indus, Mayan). See the Water Scarcity page.
No need to jump off a bridge now:
First, have a look at the Solutions page.
We can fix this!
Ecological Footprint at Other Organizations
Other organizations work with the Global Footprint Network – GFN and expand the analysis into broader areas of interest, such as:
- World Wildlife Foundation (WWF) – Living Planet Indexes
and detailed analysis of impacts on animal, plants and fish,
as well as the footprints of developed and developing nations - Earthday.org – Personal ecological footprint – A Quiz, created by the Global Footprint Network, and used at various eco friendly sites.
More Global Footprint Network Maps
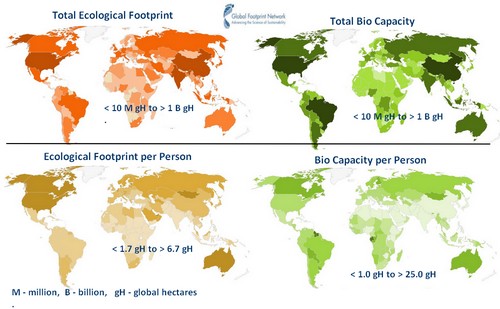
While the Bio Capacity of many nations is large, so is their population. When Bio Capacity per person is measured, many countries do not have the capacity to sustain the ecological footprint of their citizens (eco footprint). That was illustrated at the top of the page, featuring Bio Capacity deficits by nation.
Return to the top – to see Bio Capacity versus Eco Footprint, by nation.
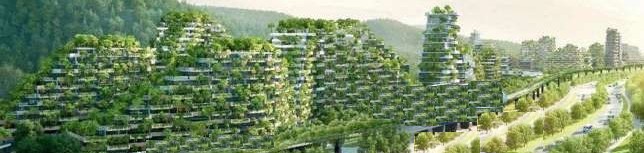
Re-Greening the Planet
This is a concept image of a new green city in China. It features trees and foliage everywhere. Some modern cities like Vancouver are exploring development codes that include green rooftops for new buildings.