
Background: Visit the ENERGY & CARBON page.
- Global Temperature Change – Spiral View
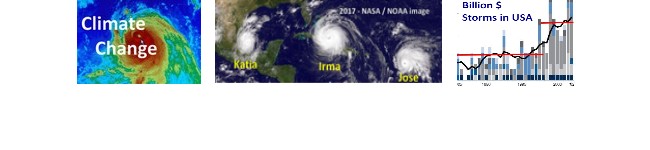
- Extreme Weather – Doubling of Hurricanes
- Billion $$ Storms Increasing in USA
. - Carbon Dioxide Causes Higher Temperatures
- Climate Change Denial
- Hothouse Earth
- Fingerprints of Human Caused vs Natural Climate Change
A – GLOBAL TEMPERATURE CHANGE (1850 – 2016)
Real data, not a model of the future.
Spiral view of world temperature: See the original continuous animation by Ed Hawkins at this link: Spiralling Global Temperatures. Color changes over time, and temperature increases to approach the first red circle at +1.5 ᴼC. See the new Tornado Version, for a real eye-opener.

Data from Met Office Hadley Centre observations datasets, collected by CRU – Climate Research Unit, University of East Anglia.
Temperatures are screaming upwards at a fast pace. The change is more rapid than in previous centuries, and even a few Climate Deniers agree that humans have something to do with it. Others don`t think it matters. But extreme weather, and a recent doubling in destructive hurricanes, tell a different story, as described next.
Return to the Top of the page
EXTREME WEATHER:
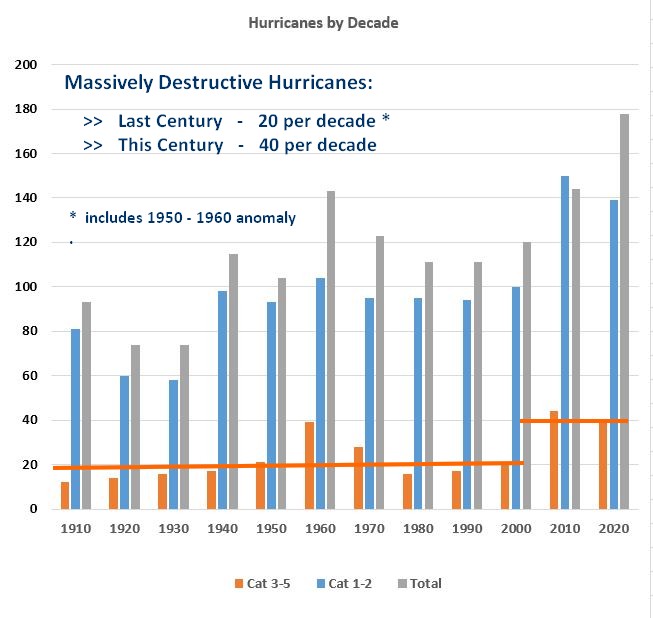
HURRICANES – Doubling in Frequency over the Last Century
Data sources are listed below. See also: Billion $$ US Weather Disasters.
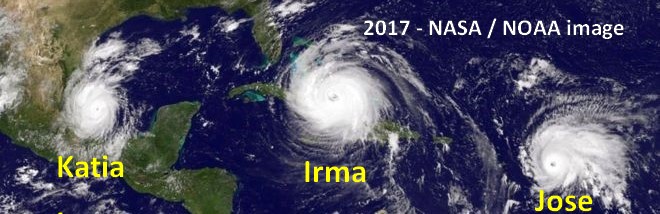
Reading about the massively destructive force of hurricanes has been heartbreaking. Many, many thousands of people have died during major storms. The aftermaths of flooding, disease and homelessness have left 100,000s of casualties (400,000 from one storm). A Category 5 hurricane or typhoon has sustained winds up to 200 mph, and rainfall and geography can create storm surges of 15 to 25 feet, traveling kilometers inward. Winds shred ships and buildings, adding debris to the storm surge water and making it more deadly. Hurricanes and tidal waves can be equally terrifying in their destructive force.
Unfortunately, the number of the most extreme storms, namely Category 3 to Category 5 hurricanes at landfall, has doubled since the year 2000. That is in comparison to the storm rate in the last century. Both sets of data are shown in the graph above, “Hurricanes by Decade”. To suggest that climate change is not having an impact on humanity is to ignore that the physical damage and human suffering from hurricanes is growing steadily, now.
Data sources: The University of Rhode Island (URI) Graduate School of Oceanography (GSO) created a website with extensive detail on hurricanes. Data for the graph above, “Hurricanes by Decade”, was taken from that Source, tabulated and analysed, to build the graph. GSO / URI bears no responsibility for the interpretation of the data given here. Any errors are mine.
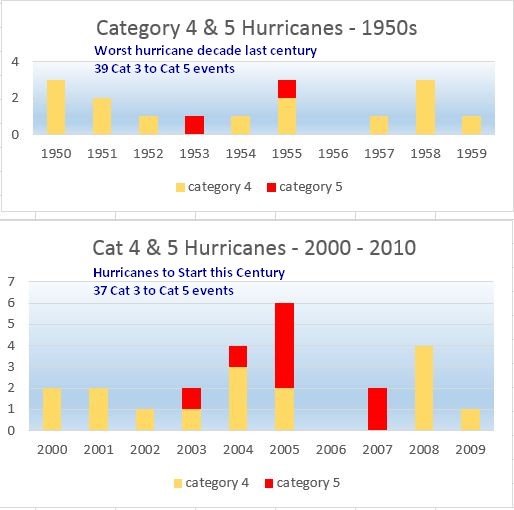
A Comparison to the Past
- Worst decade last century – 2 category five storms (red)
- Start of this century – 8 category five hurricanes
US Weather Related Disasters – Increasing
Data similar to the Hurricane patterns can be seen by downloading the World Economic Forum (WEF) 2018 Report on Global Risks. Red lines have been added to highlight the dramatic increases.
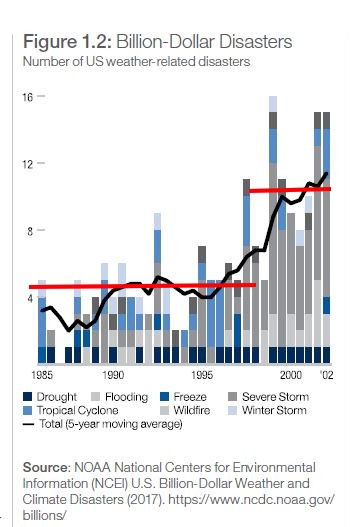
This is a graph of US weather related disasters, showing huge increases in the financial cost of extreme weather in the USA. The human cost is even greater. How does the cost of reducing carbon emissions compare with these growing disasters? Where is the tipping point? RescueTheWorld.net claims that we passed the tipping point in the year 2000 and are now 20 years behind the curve for active Solutions.
Change over Time – Properties are worth more now than in past decades and far more people live in coastal areas. The absolute (not relative) costs of damage to buildings and people is definitely rising and is a cause for major concern.
DROUGHT
The next three topics are covered in the website section on WATER SCARCITY. All are related to excess drought caused by climate change. Hurricanes in some places in the world and droughts in other places are all parts of the extreme weather package. They are listed here because they talk about the drought side of the story.
Return to the Top of the page
CARBON DIOXIDE and TEMPERATURE
Comparison 1850 – 2016 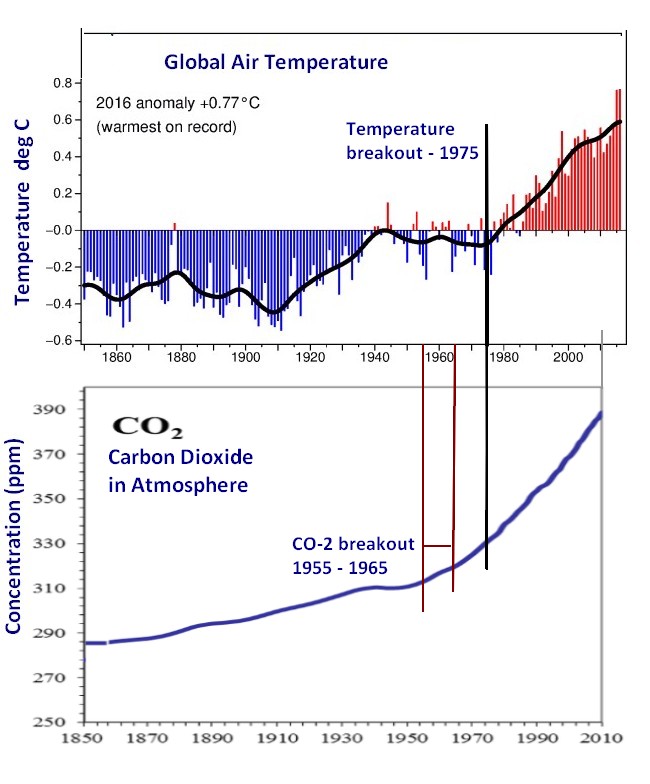
Sources: Carbon Dioxide (CO-2) level.
CRU – Climate Research Unit, University of East Anglia
Carbon Dioxide increase Causes Temperature increase:
The two graphs (of real and reliable data), show that big CO-2 level changes lead by a decade (1955 – 1965), and rapid temperature increase follows, with a breakout in 1975. Basic atmospheric physics tell us this is exactly what is expected to happen, as persistent, or long-lived, greenhouse gases trap heat. Water vapor is more plentiful, but short lived, with a cycle of only a few weeks in the atmosphere. It can have no long term trending effects, Rather, levels of humidity are controlled by the persistent greenhouse gases, like CO2. 97% of climate scientists agree that the effect is causal: Increase in CO-2 level causes global temperature to rise. This will continue until CO-2 levels are lowered.

There is much more H2O in the air than CO2. Some have argued that CO2 impact is neglible – but that omits the fact that water vapour recyles quickly (in weeks) and remains at lower altitudes. Carbon dioxide persists for hundreds of years, at higher altitudes, and literally blankets the earth. Sunlight (short wave) bounces off the earth as longer wave, warming radiation. CO2 in turn reflects that warmth back at the earth, and increases levels of water vapour at the same time, creating an amplifying effect.
Correlations to Energy Usage & Population
A visit to the Energy page shows how energy and fuel usage shot up in the 1950s, at the same fast pace as the carbon dioxide levels. The Population profile is similar. The pace continues.
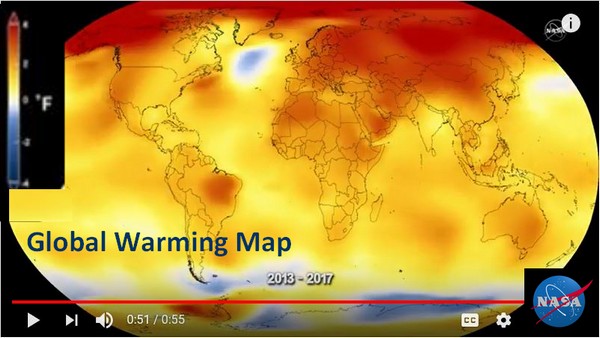
Temperature Increases Across the Globe
Average 2.6 deg F, relative to 1910. At the high end, in many northern locations, + 4.0 degrees Farenheit increases in temperature.
Return to the Top of the page
Fingerprints of Human Caused vs Natural Climate Change
The subject is well explained by Gavin Schmidt of NASA, in his
NYT Opinion piece. He outlines the many eras which reveal climate responses to the sun, the earth’s axis or other natural factors. The responses to greenhouse gases (GHGs) are also characterized and noted to be quite different. Scientists can see the fingerprints of human caused global warming in the modern era and distinguish these from background natural effects (or forcings). To paraphrase Dr. Schmidt:
The forensics are clear; humans cause global warming. Today’s temperature increases cannot be explained by sun flares, the earth’s axis, or other natural factors, like ocean currents. They are a result of GHGs.
Introduction to Climate Change at NYT:
Short Answers to Hard Questions About Climate Change
by Justin Gillis, updated July 6, 2017, New York Times – NYT
(An excellent 12 point explanation of key facts and consequences)
.
Fabulous new series:
EXODUS – The Climate Migration Crisis
(world wide), by the Weather Channel

- Climate Change Denial
The flaws in arguments dening climate change - Hothouse Earth
The risk of cascading feedback loops on climate. With feedback, the result of climate change is not a 2 – 4 deg C increase in temperature; the result is a scorched earth, unable to support human life.
Climate News Network
Climate Home News
Real Human Impacts of Climate Change
This article was recently published by BBC News:
Fiji PM: Climate change threatens our survival
Fiji PM states that 44 persons were killed and one-third of economic output was ravaged in a 2016 cyclone, and that the damage from Cyclone Josie remains to be determined. From the article: “(Climate) changes could drive freshwater shortages, bring sweeping changes in food production conditions, and increase the number of deaths from floods, storms, heat waves and droughts.”
Environmental Justice Foundation
Report on expected loss of 10% of Bangladesh land by 2050 , causing displacement of 15 million persons. Extreme flooding is happening in 2018. Other EJF work: reports and several short films on illegal fishing, slavery in fishing, bees, child labour and other topics.