Return to CLIMATE CHANGE page
- Increasing Fossil Fuel Use & CO2 Emissions
- Carbon Footprint by Nation
- Short-Lived Climate Pollution
. - Individual Carbon Footprint
- Pollution: Plastics, Industrial, …
- Limited Solar & Wind Power Today
INCREASING FOSSIL FUEL USE & CO2 EMISSIONS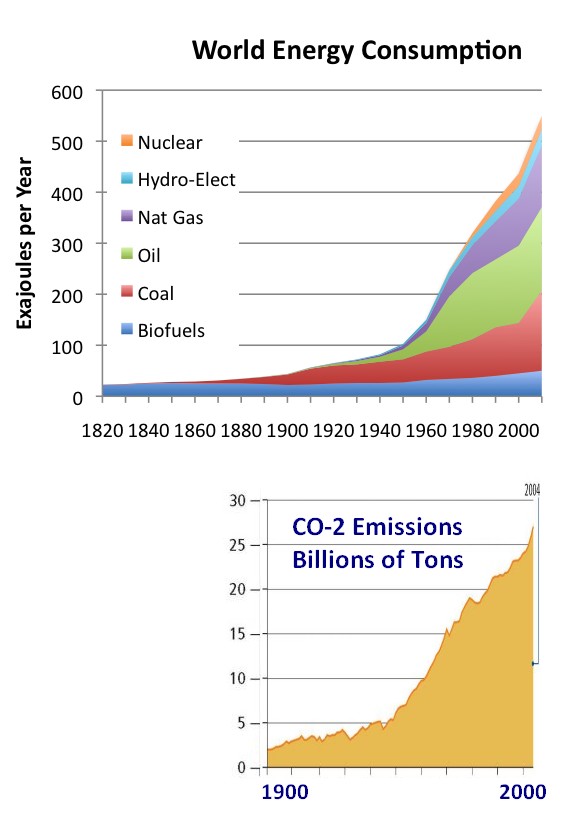
Sources of graphs above: Energy and Carbon Dioxide (CO-2)
(Carbon chart label: “World Resources Institute”, WRI.org)
Carbon Controls Climate: Water vapor is plentiful, but has a short life cycle (weeks). Carbon dioxide lasts for hundreds of years in the atmosphere. CO2 controls long term temperature increase and climate change.
Return to the top
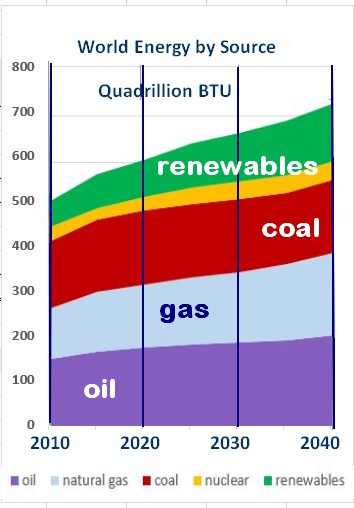
Is the trend in energy use and carbon output slowing?
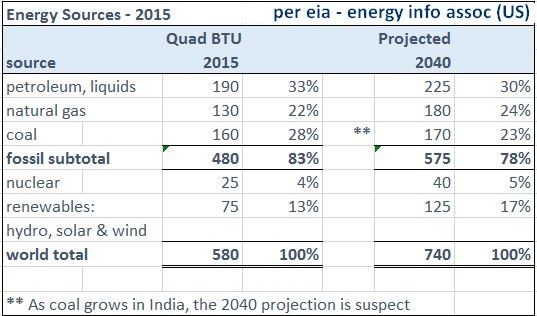
| Update for 2015 and 2040 Projection . It is hard to find a percentage for global solar and wind energy production. (Why is that?) . Solar sits at around 1% in 2015; wind may be higher? On the right, they are combined with hydro, as “renewables”. From above, hydro usage is about the same as nuclear in 2010. Renewables are growing, but remain a fraction of fossil fuels used by 2040. . Fossil fuel use increases by 95 quadrillion BTUs from 2015 to 2040, causing even more carbon emission than today (+25%), per US eia projections, right. (US energy information association) . Fossil fuel use grows, not slows. |
eia projections Download 2016.
Coal use is projected to be flat, but it is plentiful and in demand |
Paris Accord – A Cruel Promise: As the world plans more fossil fuel usage, the Accord is a false promise. Without drastic new action by nations, destructive climate change is assured.
.
Massive World Coal Reserves
- Coal reserves in 2006: _________________ 909,064 million tons.
- Coal now consumed per year: ___________ 9,000 million tons
- Years of coal reserves at current usage:____ 1,000 years
HYDRO, WIND & SOLAR
Limited Wind & Solar today
Take this link: Renewables – Limited Wind & Solar to see the active levels of alternative energy production in the world. The map shows Solar and Wind power to be only 5% to 15% of electricity generation in big CO2 emission countries, like the USA and China. Electricity is only a portion of global energy use.
Short-Lived Climate Pollutants (SLCPs) & Poverty
WRI.org Blog by Katherine Ross and Thomas Damassa – Oct 2, 2018
“3 Charts Explain One of the Most Overlooked Opportunities to Address Climate Change and Poverty”. Link: World Resources Institute
It outlines how highly potent Short-Lived Climate Pollutants (SLCPs) have an equally damaging role in causing climate change, as great as the more familiar and very long-lived greenhouse gas, carbon dioxide (CO2 – 1,000 + years). SLPCs include:
- Black carbon – biomass / wood fires for cooking, coal power, diesel
- Methane – natural gas, livestock, landfills
- Ozone gases and
- HFCs – air conditioning / fridges
Poverty Factor: A compelling argument is made in the WRI.org blog that reduction of poverty would lower high impact black carbon pollution from cooking using biomass (wood and other). Asian and US reliance on abundant cheap coal for energy production are very problematic. The sources of the SLPCs are shown in this modified image from the blog article referenced:
_______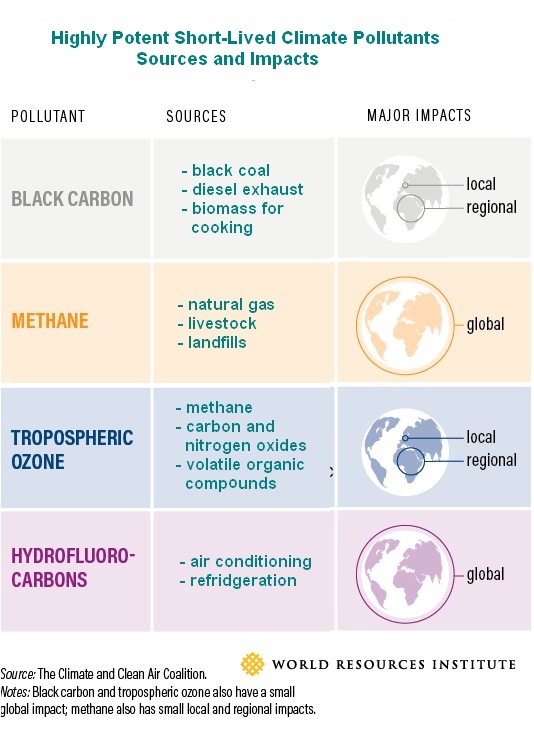
Source: WRI.org Blog by Katherine Ross and Thomas Damassa – October 02, 2018, with a modified view of the polluting sources.
Return to the top
CARBON FOOTPRINT – GLOBAL AND INDIVIDUAL
Source of next chart: EPA. Data from IPCC and CDIAC. Electricity includes industry and building use of electricity.
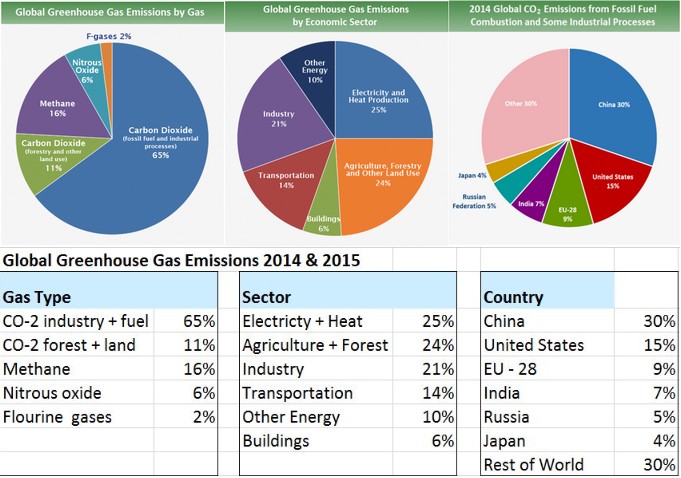
Within this data, cement is 7% and steel 5% of world totals. Animal agriculture is 17%. Note that Methane, NO2 and HFCs are much higher in warming than CO2, but do not persist as long.
What do the charts and graphs tell us:
- Energy use is skyrocketing
- Carbon Dioxide production is skyrocketing
- Renewables are growing, but not fast enough to offset fossil fuels
- If the Carbon Giants of China and the USA don’t make massive changes, the Rest of the World can just stand by and watch.
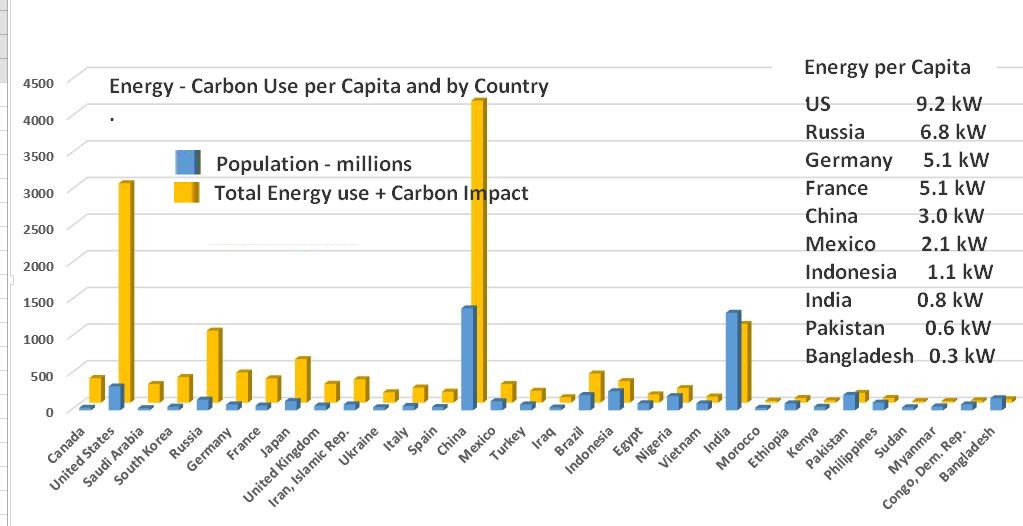
The graph above starts with the highest energy per person users at the left. Going right long the axis, energy use per person decreases, and nations with high population levels are listed. The total energy impact per nation is seen by multiplying per capita energy use, by population.
China and the US are the energy and carbon giants of the world today, followed by the EU as a group, then India and Russia. Populous countries from Mexico (next to China) through to Bangladesh at the end, have little impact on world energy use, with the exception of India, at this time. India has a quarter of the world’s coal reserves (part of the global 1,000 year coal reserve), so one can expect high-carbon energy consumption to rise there and throughout the least developed and most populous countries of the world. Future energy usage patterns are of great importance.
Recall from the Climate Change page, that CO-2 causes temperature change. A state or world economy which does not recognize that, and take action through aggressive carbon taxes, is naive. And how will 15 billion people in the future slow down the juggernaut of energy use? It’s time to have a few fewer people, by ethical means, like education. Carbon tax does not need to be additive – it can be used to offset and lower taxes on better choices – sustainable choices.
.
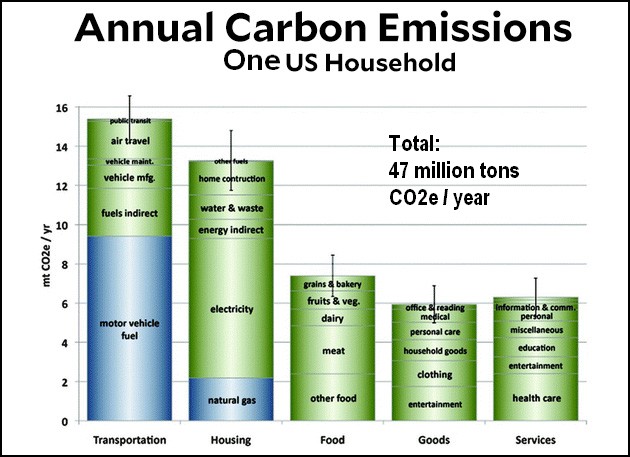
HOUSHOLD CARBON BUDGETS / SOURCES
US Households are among the highest Carbon Emitters per Capita, along with other northern developed nations, from Canada to Norway to the EU and Russia.
INDIVIDUAL CARBON FOOTPRINT –
(CALCULATOR / QUIZ ).
There are two factors that create your personal Footprint.
- The country in which you live
- Your personal lifestyle choices
You can control your personal choices directly. To control your country’s baseline footprint, it will take political action. The page on Biocapacity offers a view of Total Footprint by Country.
What Affects the Footprint of the Country Where You Live?
- Infrastructure, like roads and airports,
- Industry, like manufacturing and mega-scale agriculture,
- Power use for heating, cooling, and automation.
All of these factors create a baseline Carbon Footprint and baseline Human Ecological Footprint, for a country, and the persons who live there. Lobbying government, and / or replacing government, are the main means to altering a nation’s Global Footprint.

You can examine your Personal Ecological Footprint by taking this quiz by the Global Footprint Network – Personal Footprint Quiz. They ask for an email address and I found it OK to provide one. Great information in the Quiz and Results pages. Try modifying the things you can control (transport, food, energy savings, plastics avoidance, planting trees, greening cities, eating sustainable seafood …) – and see how it can make a difference.
Cutting out Meat and Dairy is the best way to reduce your environmental impact: per a study published in the journal “Science”, covered by CBC Radio.
Buy Carbon Offsets from airlines and / or providers like TerraPass.com, who actively create new carbon reduction projects, and are audited.
Return to the top
.
POLLUTION – Plastics
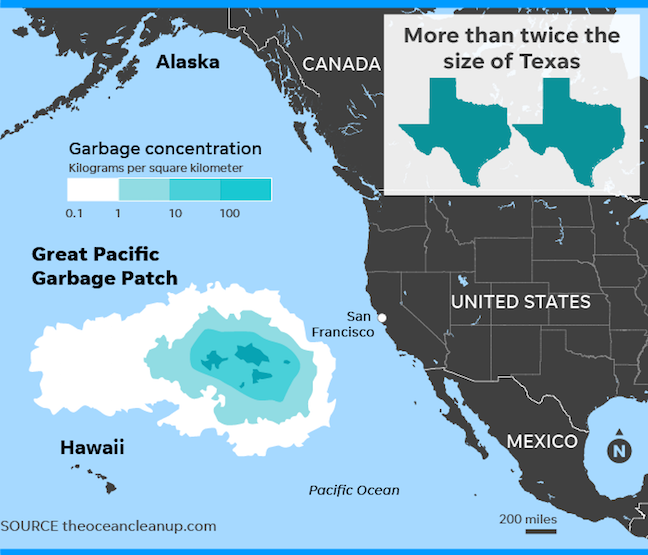
The Ocean Cleanup Project is aimed at creating floating hubs and booms to concentrate ocean plastics, for collection and removal. Update: the first boom and hub were launched in Sept. 2018. (aside: Ocean plastics are now showing up as micro-plastics in everything we eat and drink.)
Plastics Recycling is Expensive. The two main types, polyethylene and polypropylene, must be separated at great cost. The two types do not mix and cannot form a stable compound. Since re-use is costly. It is best not to use plastic at all, in packaging or elsewhere. Boycott plastic packaging and ask for something else. Alternates are paper, waxed paper, bio-degradables, …
Industrial Pollution – In addition to carbon dioxide and plastics, there are chemicals, heavy metals, pesticides (causing ocean dead zones), biological waste and other forms of pollution that must be regulated and controlled through steep fines, to achieve a sustainable planet.
Earth Day Network – Visit the site to find out more about plastics pollution prevention and general topics aimed at greening our cities and reducing fossil fuel use. Have a look at the many Earthday.org Campaigns actively in-progress.
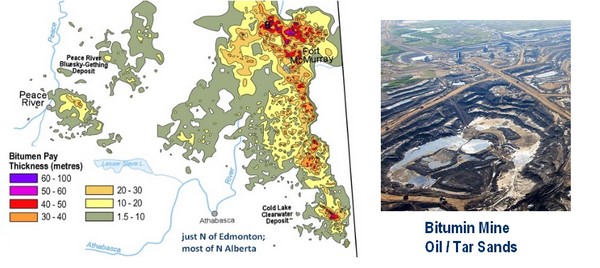
A Fossil Fuel Mine & Deposits
HYDRO, WIND & SOLAR
Limited Wind & Solar today
Take this link: Renewables – Limited Wind & Solar to see the active levels of alternative energy production in the world. The map shows Solar and Wind power to be only 5% to 15% of Electricity generation in big CO2 emission countries, like the USA and China. Electricity is only a portion of global energy use.