Jump to topics of interest:
- Temperature Pause
- Water dominates Greenhouse gases
- Consistent temperature measurements
. - Does natural carbon dominate?
- 10,000 year temperature trend
- A warmer world is more humid
Why do so many persons deny climate change? There are claims like the ones listed here, which at may look interesting at first …. but which can be disproven by facts and science.
Climate Claims by Contrarians – (and the basic Counter – Arguments)
Each of the counter-arguments is proven in more detail below:
SYNOPSYS and links to topics
- Temperature Pause
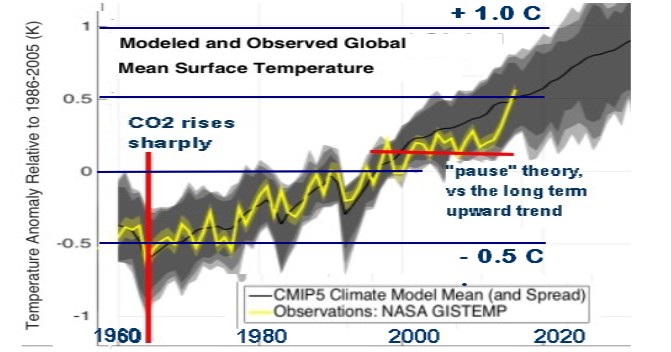
Claim: Global temperature did not increase from 1998 – 2012.
Counter: The longer term trend remains clear from observations.
Temp grows 1.5 deg C higher since 1850:

.
- Water dominates Greenhouse gases
Claim: Both water vapor (H2O) and carbon dioxide (CO2) are greenhouse gasses and there is much more water vapor than CO2.
Counter: Atmospheric physics explains how persistant gases like CO2 control the level of short-lived water vapor in the air.
. - Consistent temperature measurements
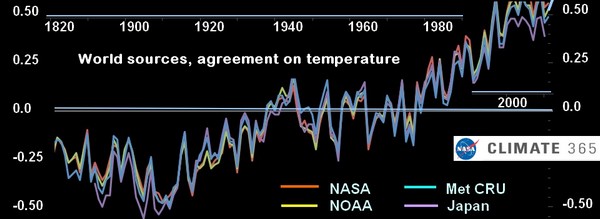
Claim: Scientists do not agree on average world temperatures.
Counter: NASA, Met, NOAA & Japan data correlate closely:
.
- Does natural carbon dominate?
Claim: the carbon cycle has large amounts of natural carbon
Counter: humans add meaningful carbon to the cycle each year
.
- 10,000 year temperature trend
Claim: A ten thousand year view shows declining world temperature.
Counter: A correction to the timeline of the graph shows it does not.
.
- A warmer world is more humid
Claim: There are threats that the world will be one big desert, but it was more humid in past warm periods on earth.
Counter: There will be both droughts and floods; the real threat is extreme weather and agricultural collapse
Rampant Climate Denial in the US is a HUGE issue,
as seen in this map:
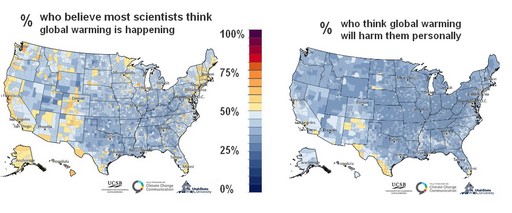
Source: Yale University Vizualization on Climate Change . Select maps by title, in the “Select Question” drop down menu. We can thank the brain-washing by big oil for this massively incorrect view of well established science. Remember when smoking was good for you?
EXPANSION of all topics
Obvious flaws in climate denial claims
1. Theoretical Pause in Global Temperature Increase
Here is a link to one of the articles by Patrick Brown, with commentary on the chart below. He observes that the pause period of 1998 – 2012 or so is not negated by later data, but deserves study, such as consideration of “unforced residuals”. (Solar, earth axis, el nino and other events). The upward trend does remain highly visible in the longer term.
The NASA GISTEMP observed temperature data tracks well with other sources, like HadCRUT4, Cowlan and Way, and NOAA NCEI.
More Evidence of longer term trends
Here is a link to an article at SkepticalScience.com, about IPCC projections, and the false theory of a global warming pause in the early 2000s. It also illustrates the fallacy of looking at a single flat period in global temperature, and taking that data out of the larger context.
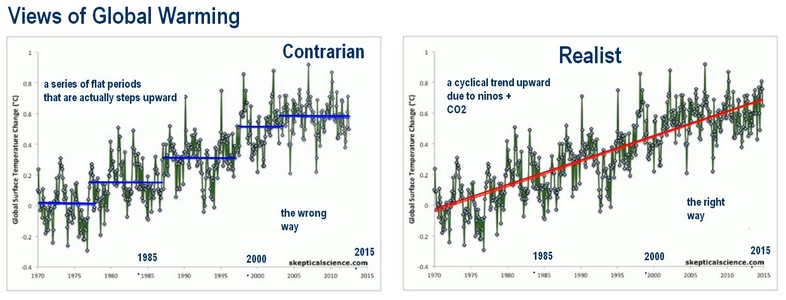
There has been no temperature pause through multiple decades of the last century.
DOWNLOAD: 39 Facts versus Myths about climate,
and the Fallacies behind them, from SkepticalScience.com
Return to top
.
.
There is more water vapor than CO2 in the atmosphere
It is argued that CO2 impact is neglible – but that omits the fact that water vapour recyles quickly (in weeks) and remains at lower altitudes. Carbon dioxide persists for hundreds of years, at higher altitudes, and literally blankets the earth. Sunlight (short wave) bounces off the earth as longer wave, warming radiation. CO2 in turn reflects that warmth back at the earth, and increases levels of water vapour at the same time, creating an amplifying effect.

Per an article by Dr. Marshall Shepard at Forbes.com: Professor Adam Sobel of Columbia University provides a nice analogy, “Saying (that) water vapor is a more important greenhouse gas than carbon dioxide, is like saying the amplifier in a sound system is more important than the volume dial for producing the sound (level). … CO2 and other long-lived greenhouse gases are the volume dial on the climate, and the water vapor amplifies the warming that they produce.”
Water vapor is short-lived in the atmosphere; it can have no long term impact or trending effect. H2O volume is controlled by other persistent greenhouse gases, like CO2.
Accuracy of Temperature Measurements
by Different World Scientific Souces
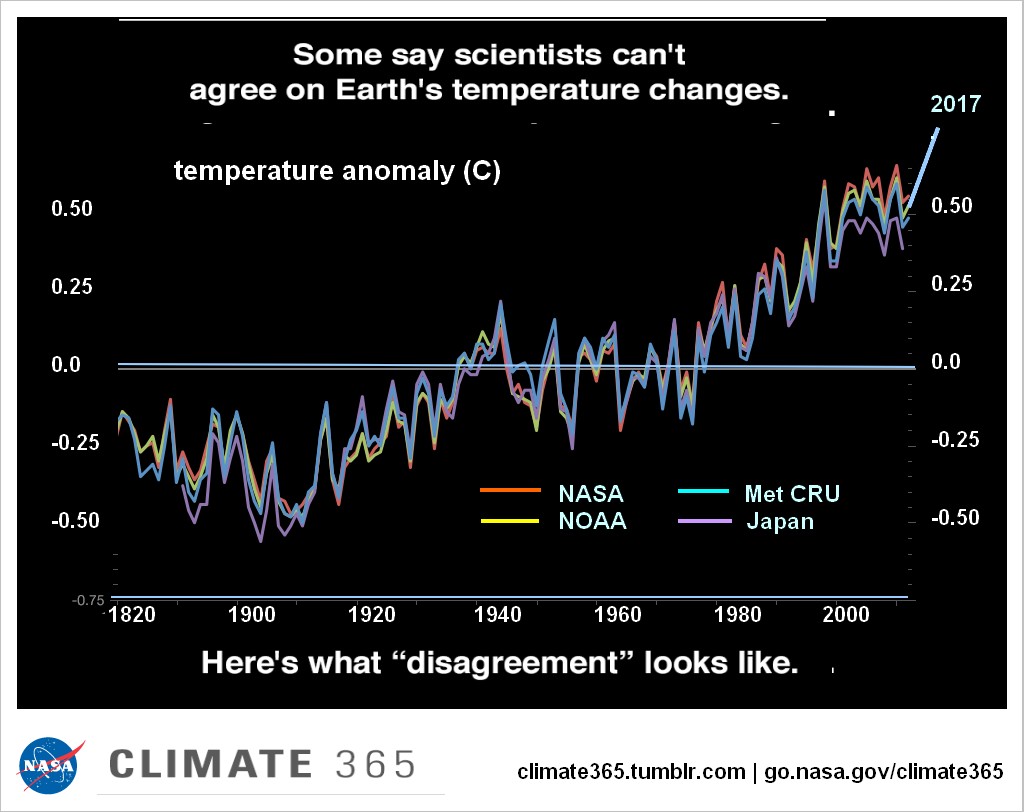
While any single year may show some variation, there is excellent agreement among scientists on how temperatures have changed over the last century.
Return to top
.
.
Does Natural Carbon Dominate its Cycle?
Link to Wikipedia Carbon Cycle (on earth) –
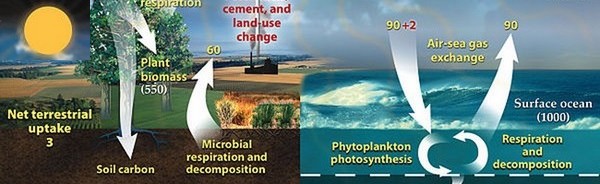
(Numbers are tabulated below.) White numbers in brackets are the amount of carbon stored (Gigatons carbon/yr). Red numbers are amounts added by humans. Yellow (Yellow) is the natural carbon cycle.
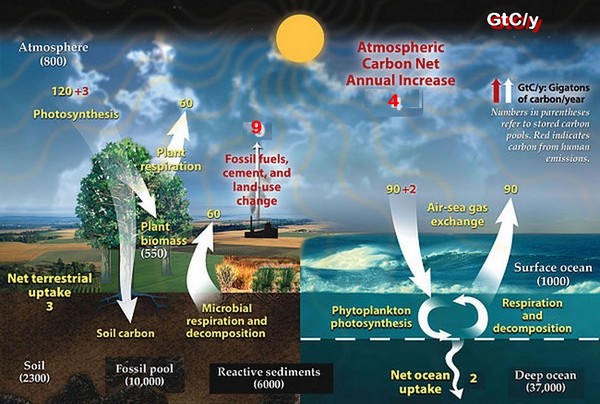
(See below for a table of the numbers in Gigatons Carbon / year – GtC/y)
The level of natural carbon cycling in and out of the atmosphere is in fact higher than the levels of carbon being created by humans. Active ocean & land (or terrestrial) carbon cycles show on the wiki image above.
Accumulating Carbon – The data from the image are shown in the next chart, to clarify. Yes, natural carbon exchange levels are much higher than what human contribute. But there is an inability for the earth’s land and oceans to absorb all carbon / CO2e we emit. Of the 9 GtC/year that humans add to the air, only 2 + 3 = 5 GtC/year are held by the earth and ocean. The rest, 4 GtC/year ( > 40% ), stays in the atmosphere and accumulates. This is why CO2 levels have risen from 300 ppm to > 400 ppm since 1950. (ppm = parts per million).
The planet’s natural carbon intake and outflow cycle is severely broken. For 400,000 years, earth’s CO2 levels have been less than 300 ppm. Now at 400 ppm, we are in a massive science “experiment” with the planet’s future.
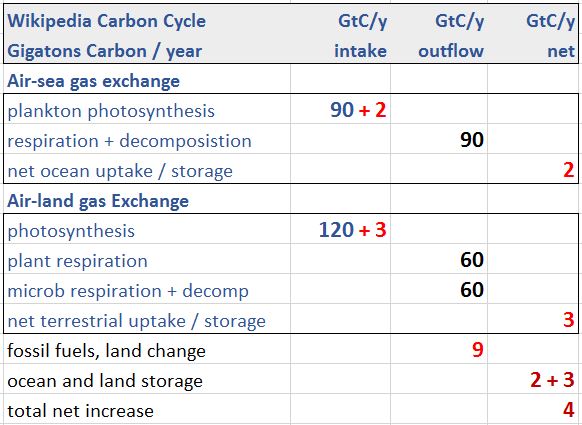
Numbers in red are human-caused carbon emissions / uptakes. As said, every year 4 Gigatons of carbon are added to the atmosphere, and it accumulates. The earth cannot absorb all human-made carbon.
.
10,000 year temperature trends
Here is a graph of temperature swings over the past 10,000 years, i.e., most of human civilization. It is attributed to David Lappi. It stops in 1950, and a +1.0 ᴼC change is expected since then (not shown). The Little Ice Age from 1300 to 1855 BC drags down the trendline. Climate Deniers have said this graph proves there is Global Cooling going on, so a “little” warming is not a worry. What is wrong with this view? Quite a lot, as seen below.
False view – a flawed timeline
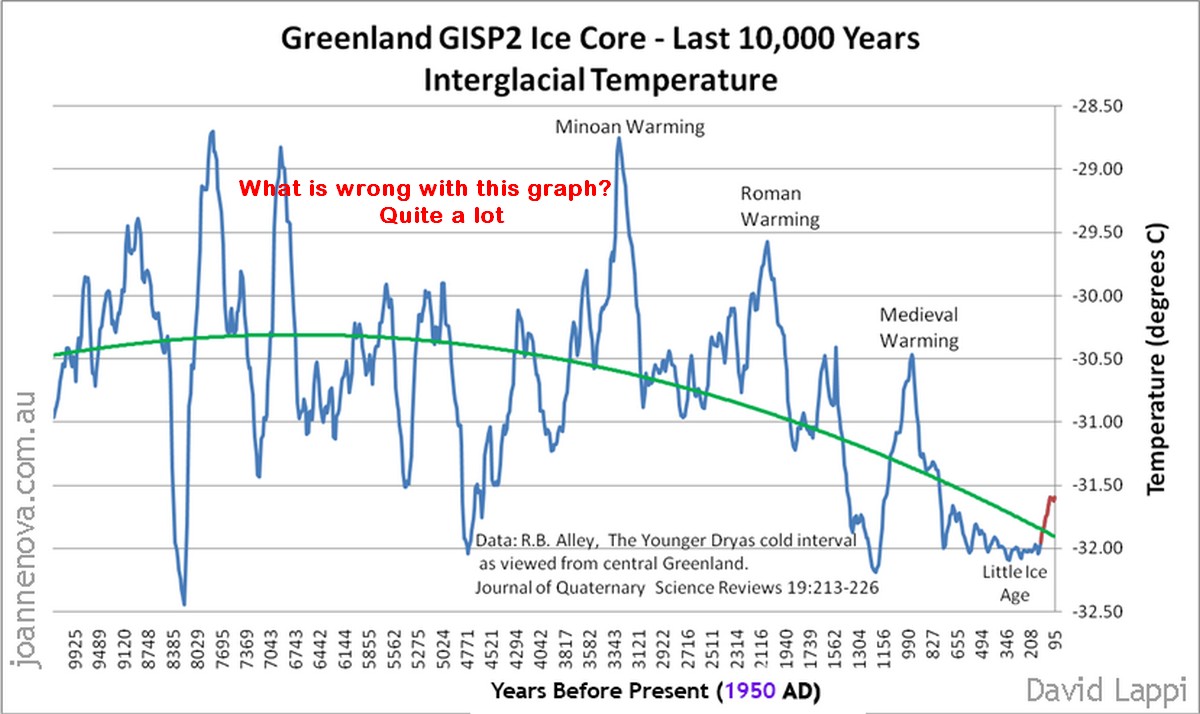
Some problems with the chart have been noted on the internet. Obviously, it ends 95 years before 1950, so the last temperature upturn of + 1.3 ᴼC is not seen. More interestingly, the time scale is not constant. Early periods are squashed together above. Dates change by 350 years on the left, at 8,000 BC, and only by 100 years at the right, at 1855 AD. Here is a new view, with a “stretch-a-roo”, to create a constant time interval horizontally:
Proper view of the data – corrected timeline:
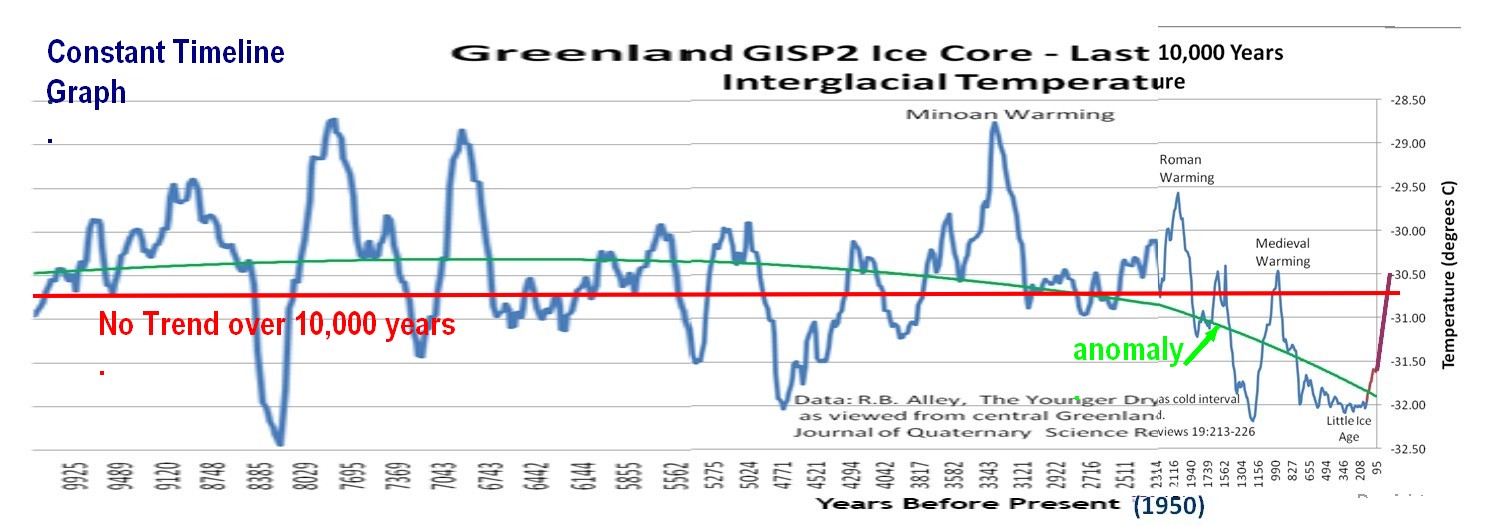
In the constant timeline view, it is not so obvious that anything is trending up or down over 10,000 years, although rises and falls do occur. Roman and Medieval “warmings” are not as pronounced. The Medieval one really disappears. The Little Ice Age from 1300 to 1850 AD is just one of the longer dips. More importantly, temperatures have risen sharply from the lows which preceded the modern era. The speed of temperature change magnifies droughts and floods and hurricanes.
Back in the Medieval “warming” period, there were around 300 million people. Today there are more than 7 billion, a 20 – fold increase. The demand on world agriculture, fresh water and energy has multiplied at an even greater pace.
A hotter world will be humid, not a desert
(Scare tractics make climate gloom & doom sound fake)
Sometimes climate change proponents (not scientists) get carried away and speak untruths, like the scary and unlikely desert map shown below. It predicts desert over 70% of the planet, with only a few green acres in Canada, Russia and the Antarctic. But it is not time to buy real estate yet.
Coal and oil deposits were made during hot periods on earth, when it was also wet and tropical, and there were abundant rain forests. When dinosaurs lived, there was more water evaporation and water vapour in the air. There were probably plenty of monsoons, typhoons, cyclones and hurricanes too.
_____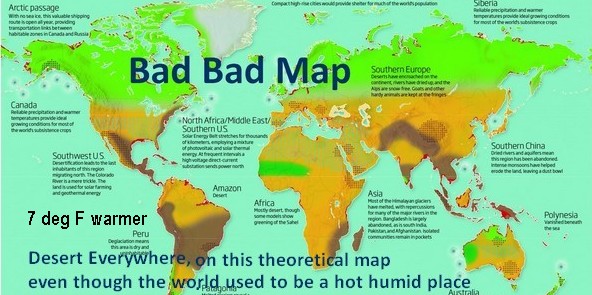
Credit – created 2009. The map still shows up some places on the internet, but no one seems to be claiming credit these days, for obvious reasons. It is an example of shoddy work that climate deniers can use to say – “It’s not real”.
The real problem is Extreme Weather, both droughts and floods, which will lead to agricultural and social collapse.
Arguments at Climate Denial Conferences
- Some denied the Earth’s atmosphere was changing;
- Others said the Earth was actually cooling;
- Others said it was warming for entirely natural reasons;
- Still others accepted that carbon dioxide in the atmosphere was causing the planet to warm, but argued the ensuing changes were good for life on Earth. (Plants need CO2)
- (Quote above from Frontline article: “In Shift, Key Climate Denialist Group Heartland Institute Pivots to Policy”)
Clearly, there are many contradictions and a lot of confusion in these theories that that climate change is not human caused.
Visit the link to learn more about:
- The Deceiver
- The Deceived
- The Self-Deceived
- The Skeptic
- The Truly Ignorant
Learn how to talk to them, based on their particular bias, as indicated by the perjorative title for each. (It was fun to write this)
.
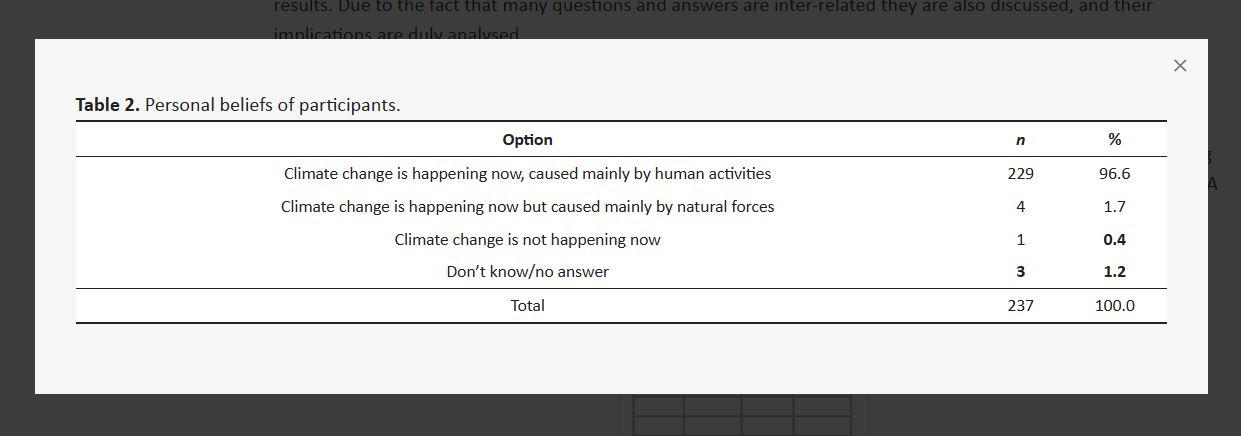
96.6% of Scientists agree that the Climate Crisis is Human Caused