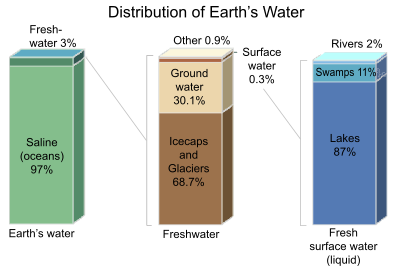
- Fresh Water versus Salt Water and World Ice.
- Aquifers or Ground Water Depletion
- Water for Animal and Crop Agriculture
.
LIMITED FRESH WATER
Learn more from the source:
Water Distribution on Earth, at Wikipedia
We all know that most of the water on Earth is salty, and not drinkable. But how often do we think of the fact that only 0.3% of the World’s fresh water is in lakes and rivers, while 70% of it is trapped in ice caps and 30% is in the ground? Thank you, Wikipedia, and contributors, for these stunning facts about the very limited fresh water that we can access on the surface.
.
LOSSES IN GLOBAL AQUIFER LEVELS
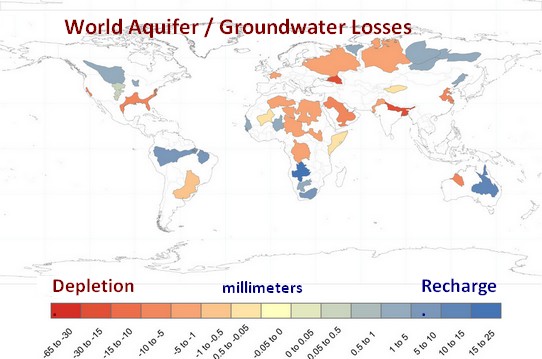
Aquifer level is recharging in rainy parts of the world like the Amazon. But it is in serious distress in some high population areas like Pakistan, N. India, Bangladesh, Crimea, California and Texas to Florida.
Credit – The 2015 Aquifer depletion map is taken from NASA Satellite Imagery research by Alexandra S. Richey et al, of NASA’s Water Resources Research, and later reported by a number of news agencies.
Causes of Aquifer Depletion
- Fracking for oil & gas
- Agriculture during droughts (placing food supply at risk)
- Climate-change-based droughts
- Poor water infrastructure & management
- Dams in upstream counties (SE Asia, Ethiopia, …)
- Manufacturing
- Cities and urban usage
Click image to read the article on crops.

WATER USE IN ANIMAL & PLANT AGRICULTURE
A great deal of information is conveyed in one single chart, about the water cost of creating calories and protein from animal versus plant food types. Five times as much water is needed to produce a gram of protein from beef as from pulses (beans, legumes, soy).
Nuts require as much water per gram of protein as meat, but the nuts do not suffer in the same way that cows, pigs, chickens and sheep do. Avocados have much lower water use per gram of fat than the average vegetable. Sugar crops have no protein, no fat and no nutirents.

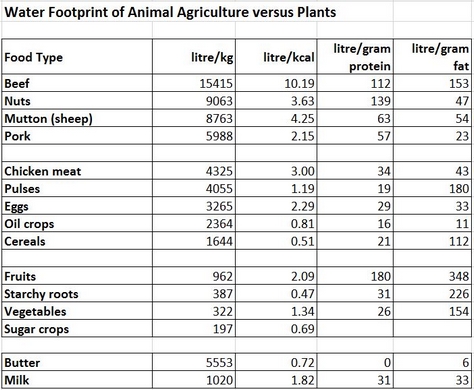
Link to the Chart and extensive other data on Water Footprint globally is: WaterFootPrint.org. Chart data source: Mekonnen, M.M. and Hoekstra, A.Y. (2010), Value of Water Research Report Series No.48, UNESCO-IHE.
.
Return to the top
.
WATER STRESS and WORLD CONFLICTS
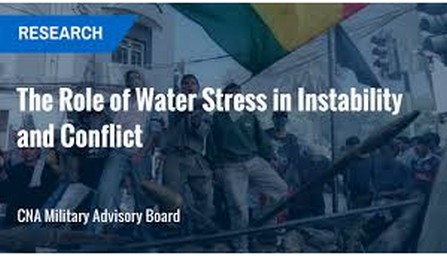
Download CNA Water Stress. CNA. 2017. The Role of Water Stress in Instability and Conflict. CRM-2017-U-016532. Final. Check your download folder for the PDF document.
This highly readable document notes trends driving lack of adequate fresh water: 1) population growth, 2) migration, urbanization, and meat & grain agriculture, 3) climate change: floods, droughts, & sea water intrusion into aquifers.
It explains how terrorists use control of water infrastructure to break resistance and recruit followers. Conflict areas are described, such as:
1) ISIS in Syria and Iraq, 2) Boko Haram in NE Nigeria near Lake Chad,
3) Yemen’s war & massive water shortage 4) Crimea water blockade
Tensions continue to rise in additional regions of the world, such as:
1) Mekong R. delta and its dams, 2) India rivers to Pakistan, …
3) Lake Uremia losses in Iran, 4) a new Nile R. dam in Ethiopia.
Return to the top
More Desert in Africa and the Middle East
Image of an African village turned into a dust bowl.
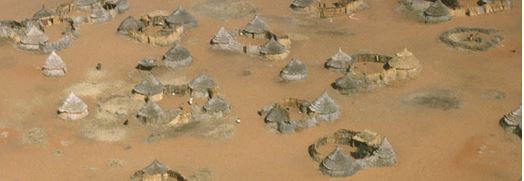
A gripping essay by Matt Hongoltz-Hetling is called The Nonexistant, and is part of the weather channel series Exodus, featuring human migrations. It exposes how long climate refugees have existed in the world, but nations have denied them “refugee” status. Some quotes:
Over the past decade, an average of 26.4 million people — more than the entire Australian population — were displaced by natural disasters each year, according to the Center for Migration Studies. (264 million per decade) … and … The U.N. … (still) says that climate, environmental degradation and natural disasters are “not in themselves causes of refugee movements.” (end quotes)
The GDELT Project maps events from global news sources. An animated map at the site shows daily numbers of attack and protest events around the world, in the 2013 – 2014 timeframe. In 2018, the UN reports 58 million displaced persons, greater than the number of migrants after WWII.
_________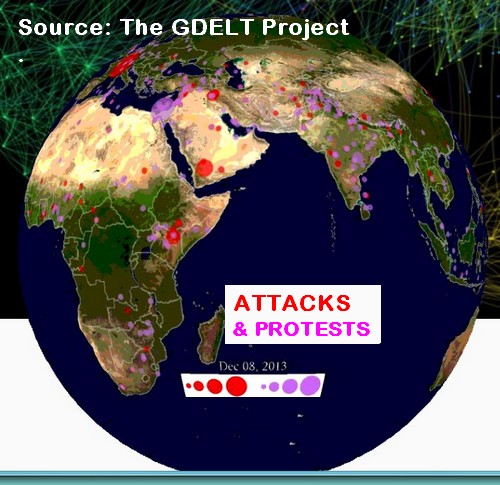
. . . . . . . GDELT – Attacks and Protests in 1 day
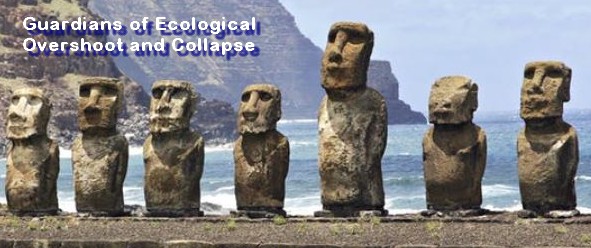
Drought and Lost Civilizations
A combination of severe and extended drought (decades to centuries), plus rapid population growth, and deforestation for agriculture, were significant contributors to the disappearance of three ancient civilizations. Based on radar imaging, it is now believed that each of these empires had several million people, extensive roadways and water control systems. But drought defeated them.

Check the link on Lost Civilizations:
The collapse of civilizations in Egypt, Greece and Mesopotamia in the bronze age, around 4,600 to 4,000 years ago, is in part attributed to drought. Drought, and overpopulation versus the biocapacity of a region, have doomed past human civilizations. Are we ready to do that again? On a global scale?
On the Climate Change page, in the section on climate impact denial, a graph shows temperature swings of +/- 2.0 ᴼC in the past 10,000 years. It suggests we are in a global cooling period and a few warm years are “OK”. But in some of those “swing” time periods, major civilizations were wiped off the face of the earth.
(a) – The Water Resources Research Institute of the University of North Carolina (UNC), regarding Nutrients, Stormwater, Drinking supply, and Toxic chemicals and wastewater treatment.
.
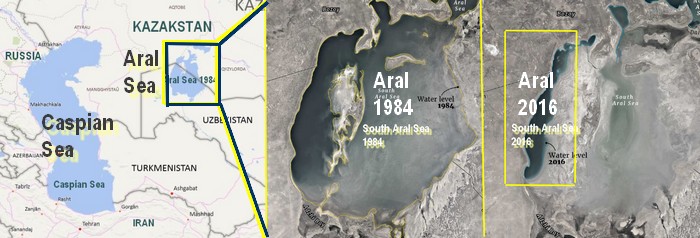
LOST WATER RESERVOIRS
Some of the world’s larger water bodies are simply disappearing. Lake Chad in Nigeria is 90% gone, and local fishermen and farmers are pulled into the terror group Boko Haram. The Aral Sea in the north middle-East has nearly vanished and just south of it, Iran has severe water loss. All of these areas are contributing world conflicts.